
Last reviewed 14 November 2026. Every figure on this page was checked against the sources listed at the end of the page; where two sources disagree, the difference is stated.
The United States received 68.3 million international visitors in 2025 (68,287,793 to be exact), 5.5% fewer than in 2024 and 86% of the pre-pandemic 2019 total, according to the National Travel and Tourism Office (NTTO) at the Department of Commerce. Those visitors spent $250.2 billion on travel and tourism in the US, down 0.6% on the year. Most of the fall came from Canada, whose visitor numbers dropped by a fifth. The figures below come from NTTO, the U.S. Travel Association, the World Travel & Tourism Council (WTTC) and the National Park Service, using the latest data published by November 2026.
Key US tourism statistics
- The US recorded 68.3 million international visitor arrivals in 2025, down 5.5% on 2024's 72.4 million (NTTO).
- Mexico was the largest source market with 17.98 million visitors (+6.4%); Canada fell 20.9% to 16.02 million (NTTO, 2025).
- The United Kingdom was the largest overseas market with about 4.1 million visitors in 2025 (NTTO).
- International visitors spent $250.2 billion in 2025, about $686 million a day (NTTO, including fares, education and medical spending).
- Florida was the most-visited state among overseas visitors in 2025 (9.34 million) and New York City the most-visited city (8.92 million) (NTTO).
- Americans took 2.40 billion domestic trips in 2025 (U.S. Travel Association and Tourism Economics).
- Travel supported more than 15 million jobs and accounted for 2.4% of GDP in 2025 (U.S. Travel Association).
- National Park Service sites recorded 323 million recreation visits in 2025, led by Great Smoky Mountains among the national parks (NPS).
- NTTO forecasts 70.5 million international arrivals in 2026 (+3.2%), partly driven by the FIFA World Cup.
International arrivals: still below the 2019 peak
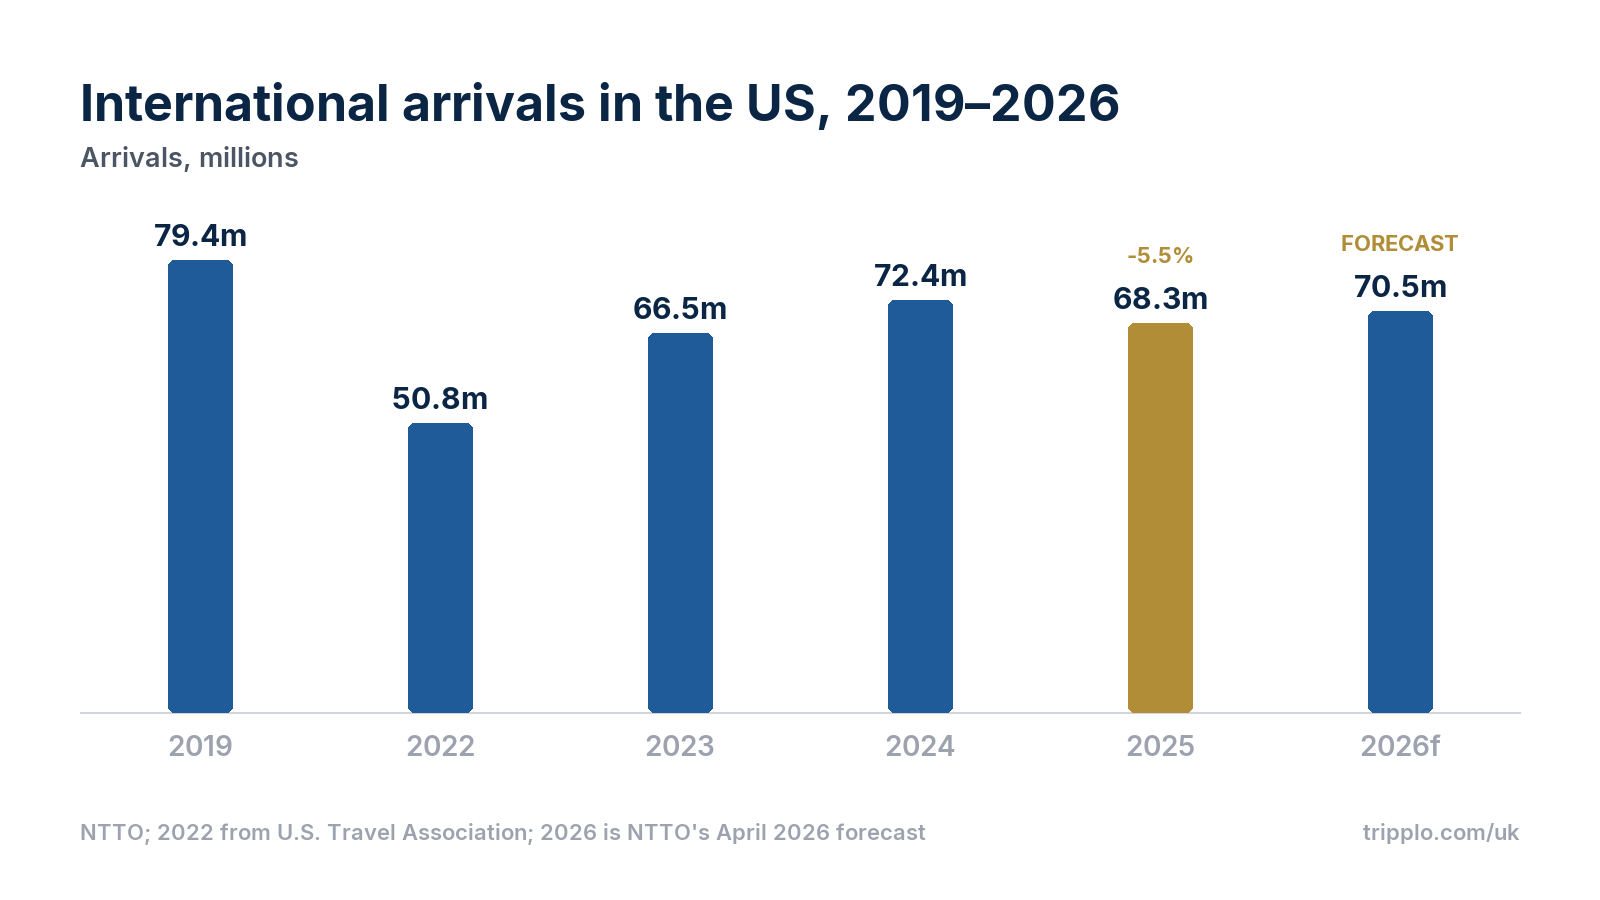
International travel to the US has not yet returned to its 2019 level. Arrivals fell to 19.2 million in 2020, recovered to 66.5 million in 2023 (+31%) and reached 72.4 million in 2024 (+9.1%), before slipping back in 2025. In short form the series reads 79.4m in 2019, 50.8m in 2022, 66.5m in 2023, 72.4m in 2024 and 68.3m in 2025, with NTTO forecasting 70.5m for 2026.
- Overseas arrivals (all countries except Canada and Mexico) totalled 34.3 million in 2025, down 2.5%, against 35.2 million in 2024 and 40.4 million in 2019 (NTTO).
- 2025 was 86% of 2019 for all arrivals; overseas visitation stood at 85% and Canada at only 77% of its 2019 level, while Mexico reached 98% (U.S. Travel Association forecast tables).
- The two main series differ slightly: the U.S. Travel Association's tables, compiled with Tourism Economics, show 66.3 million arrivals for 2023 and 72.3 million for 2024, against NTTO's 66.5 million and 72.4 million. This article uses NTTO's figures where both exist; the 2022 figure of 50.8 million is from the U.S. Travel Association.
- Earlier forecasts proved too optimistic. In February 2024 NTTO expected 85.2 million arrivals in 2025; the outcome was 68.3 million.
- NTTO now forecasts that arrivals will not pass the 2019 record until 2029, when it expects an all-time high of 82.3 million, rising to 85.2 million in 2030.
Source markets: Mexico, Canada and the UK
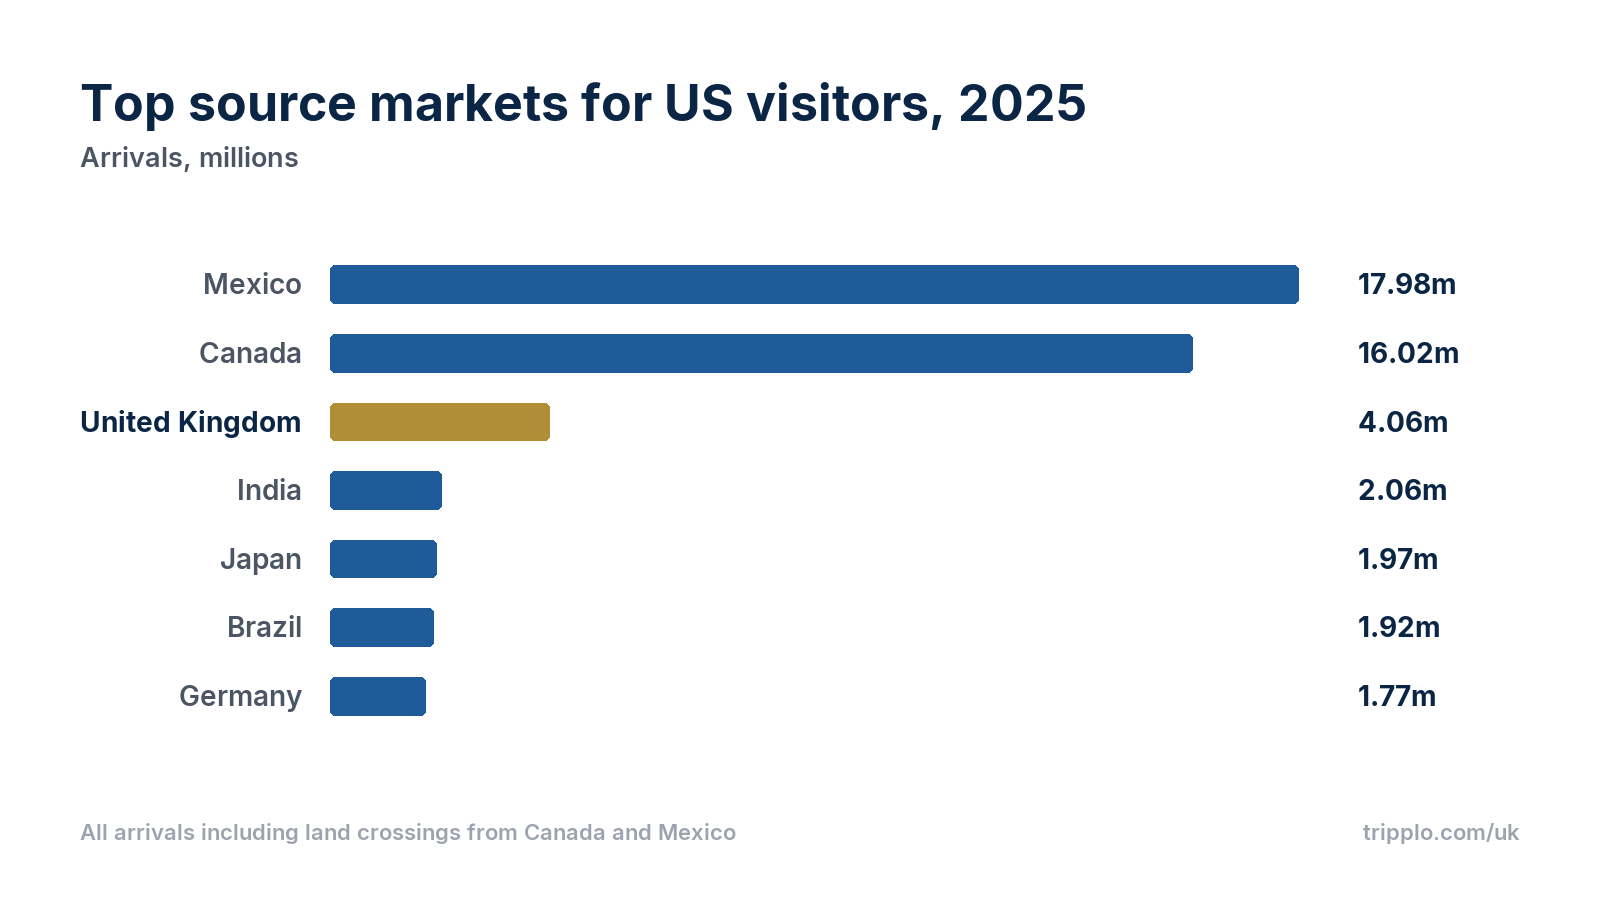
Canada and Mexico together supply roughly half of all visitors to the US, and most of them arrive by land: NTTO counted 8.6 million Canadian and 3.5 million Mexican air arrivals in 2025. The twelve largest source markets accounted for 77.2% of all arrivals in 2025 (NTTO).
- Mexico: 17.98m (+6.4%)
- Canada: 16.02m (-20.9%)
- United Kingdom: 4.06m
- India: 2.06m
- Japan: 1.97m
- Brazil: 1.92m
- Germany: 1.77m
Canada's slump was the single biggest story of 2025: visitor numbers dropped from 20.2 million in 2024 to 16.0 million. Mexico, however, grew and overtook Canada as the largest market. In Europe, Travel Weekly reports that Western European arrivals fell 3.7% to 12.6 million, with Germany down 11.3% and France down 6.8%, while Italy rose 5.3% and Spain 1.5%.
For British readers: the UK remained the largest overseas market, almost twice the size of India, but growth stalled, with UK air arrivals up just 0.5% in 2025. NTTO's forecast tables put UK arrivals at 4,058,000; Travel Weekly gives a higher figure of 4.6 million, and the difference between the two counts is not explained. NTTO forecasts UK visitation to grow 3.5% in 2026. Visiting has also become more expensive: the ESTA travel authorisation fee rose from $21 to $40 for applications made on or after 30 September 2025 (CIBT Visas).
Where international visitors go: states, cities and national parks
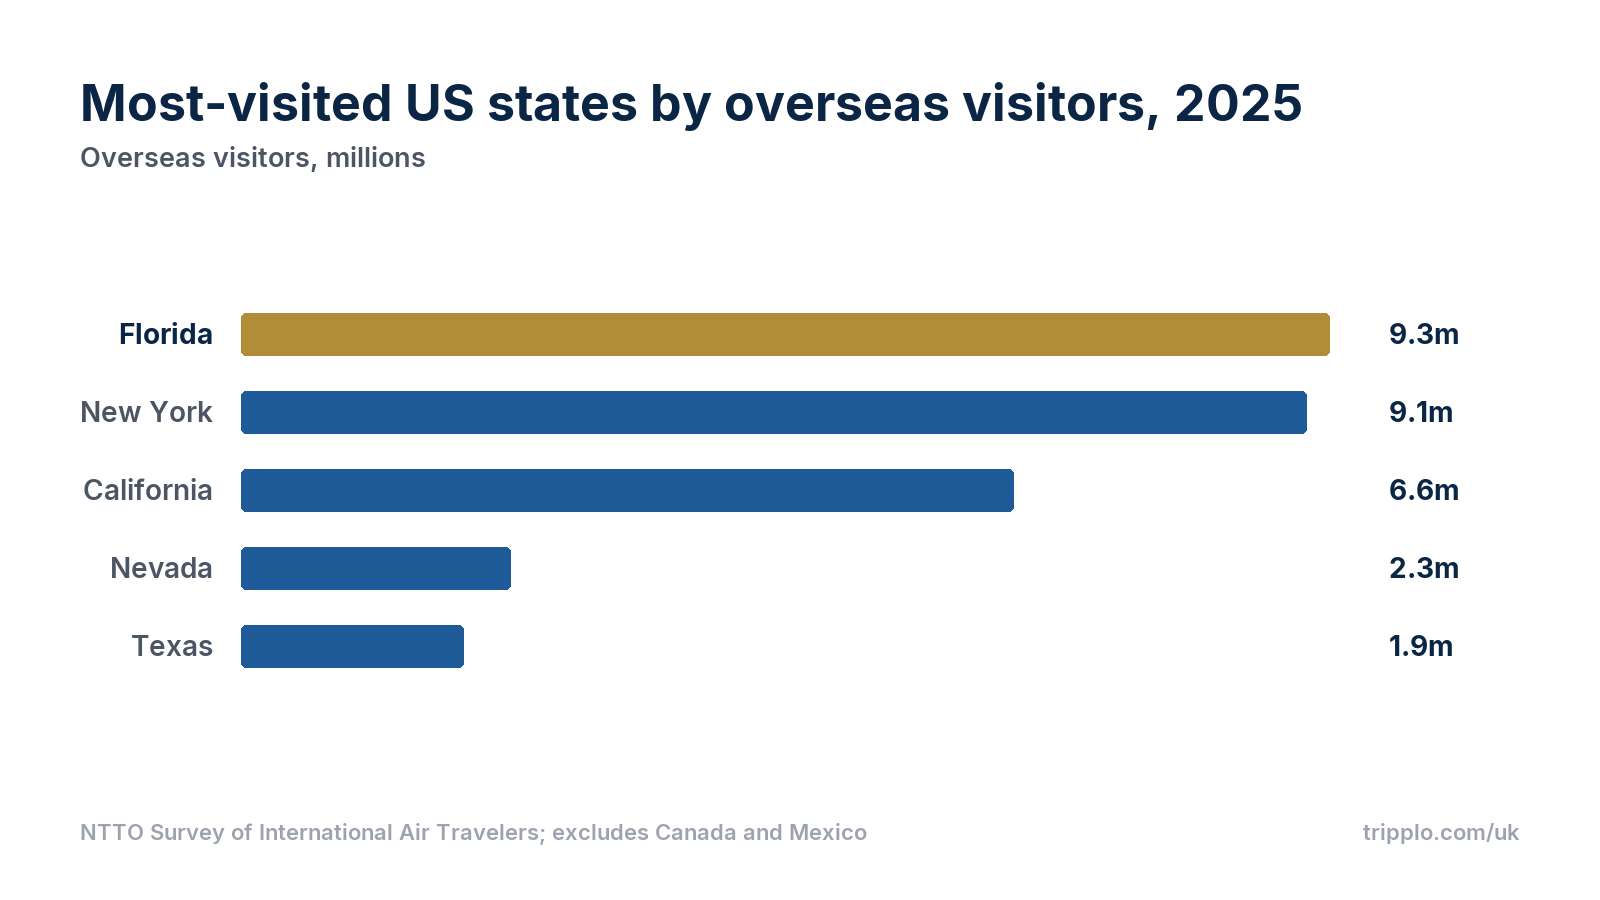
NTTO's air traveller survey shows that overseas visitors concentrate on a handful of states. The top five states took 62.5% of overseas visitors in 2025, and the top five cities 48.9%.
- The most-visited states by overseas visitors in 2025 were Florida (9.3m), New York (9.1m), California (6.6m), Nevada (2.3m) and Texas (1.9m) (NTTO Survey of International Air Travelers).
- Florida gained the most visitors of any state, up 480,000 on 2024, while Puerto Rico posted the largest percentage gain (+60.1%) (NTTO).
- New York City was the top city with 8,915,000 overseas visitors. Among business travellers, New York City (892,000) led Los Angeles (485,000), San Francisco (374,000), Miami (372,000) and Las Vegas (275,000) (NTTO).
- Canadian air travellers favoured Florida (2.6 million), California (1.5 million) and Nevada (1.0 million); Mexican air travellers most often visited California (707,000), Florida (608,000) and Texas (548,000) (NTTO).
- National Park Service sites recorded 323,014,305 recreation visits in 2025, with 26 parks setting records. Great Smoky Mountains was the most-visited national park (11,527,939), ahead of Zion (4,984,525), Yellowstone (4,762,988), Grand Canyon (4,430,653) and Yosemite (4,278,413) (NPS).
- Britons are the biggest overseas group in the parks: 1.7 million UK visitors went to a national park or monument in 2025, ahead of France (918,000) and Germany (895,000) (NTTO market profiles).
Visitor demographics: who comes and why
NTTO's Survey of International Air Travelers for 2025 gives a profile of the 34.3 million overseas visitors.
- Main purpose of trip: holiday 57.1%, visiting friends or relatives 22.2%, business 16.4%.
- Average stay: 16.9 nights, with average spending of $1,829 while in the US.
- Travel party: 58.6% travelled alone, 21.4% with a spouse or partner and 18.3% with family or relatives.
- Average combined household income: $90,880.
- Planning: visitors decided on the trip 104 days ahead and booked flights 79 days ahead.
- Most popular activities: shopping (82.9%), sightseeing (77.8%), national parks and monuments (33.9%), art galleries and museums (28.3%), and small towns and countryside (27.6%).
- 71.4% stayed in a hotel or motel, and 75.4% visited only one state.
- Satisfaction is high: 97.2% said the trip met or exceeded expectations, and 96% expect to return.
Canadian air visitors stay much shorter, at 7.8 nights on average and spend $1,037, while Mexican air visitors average 11.8 nights and $1,314 (NTTO).
Spending and the tourism economy
How much international visitors spend depends on what is counted. NTTO's travel export figure of $250.2 billion for 2025 includes airfares paid to US carriers and spending by students, medical patients and short-term workers. WTTC and the U.S. Travel Association, which measure visitor spending only, both put international visitor spending at $176 billion in 2025, down 4.6% according to WTTC.
- In December 2025 alone, international visitors spent more than $21.3 billion, down 3% year on year, while US residents spent more than $23.2 billion abroad (NTTO).
- WTTC says Travel & Tourism contributed $2.63 trillion to US GDP in 2025 and supported 20.4 million jobs, and that the US remained the largest Travel & Tourism market in the world while losing market share.
- The U.S. Travel Association, on its own method, reports that travellers spent $1.4 trillion directly in 2025, producing $3.0 trillion in economic output, $92 billion in state and local taxes and more than 15 million jobs, 8 million of them direct. Travel accounted for 2.4% of national GDP.
- International inbound spending stood at 80% of its 2019 level after inflation, against 104% for domestic leisure spending (U.S. Travel Association).
Domestic travel: Americans carry the industry
Domestic travellers dominate US tourism. According to the U.S. Travel Association and Tourism Economics, Americans made 2.40 billion domestic person-trips in 2025, up 1.5% and above the 2.32 billion of 2019.
- Of those trips, 1.95 billion were for leisure and 441.3 million for business (2025).
- 2.20 billion domestic trips were made by car and 198.9 million by air, the only segment to shrink in 2025 (-0.6%).
- Domestic travel spending reached $1.185 trillion in 2025 in inflation-adjusted terms, of which $900.3 billion was leisure. WTTC's broader measure puts domestic visitor spending at $1.54 trillion, 14.3% above pre-pandemic levels.
- For 2026 the association forecasts 2.44 billion domestic trips and total travel spending of $1.374 trillion.
2026 so far: a World Cup year with mixed results
The 2026 FIFA World Cup, co-hosted with Canada and Mexico, was expected to lift arrivals; WTTC estimated about 1.24 million international visitors for the tournament period. The monthly data so far show a split picture.
- In July 2026 total arrivals were 6,248,242, down 0.1% on July 2025: Canada rose 7.6% and Mexico 8.0%, but overseas arrivals fell 7.0% (NTTO).
- August 2026 brought 6,754,679 arrivals (-1.4%). Overseas arrivals dropped 11.8%, while Mexico (+9.9%) and Canada (+8.8%) grew. The UK sent 376,681 visitors that month, the most of any overseas market (NTTO via Hotel Online).
- Overseas arrivals fell 4.3% to about 2.7 million in September 2026 and were down 5.7% for January to September. Western Europe accounted for almost three quarters of the September drop, with France down 15% and Germany 10%, while China rose almost 15% (NTTO via Skift).
- Spending has held up better: international visitors spent $185.6 billion in January to September 2026, less than 0.5% below the same period of 2025, and the US recorded a travel trade surplus of nearly $5.2 billion over those nine months (NTTO via Hotel Online).
Canada is recovering from a very low base. Canadian return trips from the US rose 6.8% in September 2026, a sixth straight monthly gain, yet car trips were still 31% below September 2024 (Skift). On current trends NTTO's 2026 forecast of 70.5 million arrivals depends heavily on Canada and Mexico, since overseas demand is running below 2025.
Sources
- International Inbound Travel Association: NTTO December 2025 international travel volume
- NTTO: International Visitor Forecast (April 2026)
- NTTO: International Visitor Forecast (March 2025)
- NTTO: International Visitor Forecast (February 2024)
- NTTO: 2025 Survey of International Air Travelers results
- International Inbound Travel Association: NTTO 2025 SIAT results for Canada and Mexico
- NTTO: U.S. States and Cities Visited Monitor, 2025 update
- International Inbound Travel Association: NTTO market profiles of overseas visitors, 2025
- NTTO: December 2025 international visitor spending
- NTTO: July 2026 total international travel volume
- Hotel Online: US international visitor arrivals slip in August (NTTO data)
- Hotel Online: US travel exports in September 2026 (NTTO data)
- Skift: US overseas travel decline, September 2026
- WTTC: U.S. remains world's largest Travel & Tourism market
- U.S. Travel Association: Travel Forecast, Spring 2026
- U.S. Travel Association: Economic Impact of the U.S. Travel Industry, 2025 national data
- National Park Service: 2025 visitation statistics
- Travel Weekly: UK-US market stagnates as overall visitor numbers decline
- CIBT Visas: ESTA fee almost doubles
Luxury travel, straight to your inbox
Every other week we share destinations and hotels worth the journey, from hidden boutique hideaways to classics that live up to their name.